Transform the way you select stocks with Kalkine
Get Cutting-Edge Stock Recommendations
SEBI Registered Independent Research Analyst
Explore for 7 Days free trial now

Why Kalkine ?
Empower your Decisions through Kalkine’s Tech-Driven Stock Research

Professionally Managed

Performance Transparency

Easy Portfolio Tracking
Recent Picks
View AllEntry Price:
Entry Price:
Entry Price:
Entry Price:
Market Scan
| Ticker | Name | Price(INR) | Change(INR) | %Change |
|---|---|---|---|---|
| FAZE3Q | Faze Three Ltd. | 441.60 | 73.60 |
 20.00%
|
| AVALON | Avalon Technologies Ltd. | 1022.70 | 170.45 |
20.00%
|
| ICIL | Indo Count Industries Ltd. | 286.33 | 47.72 |
20.00%
|
| GRWRHITECH | Garware Hi-Tech Films Ltd. | 3908.60 | 651.40 |
20.00%
|
| CAMLINFINE | Camlin Fine Sciences Ltd. | 168.85 | 28.14 |
20.00%
|
Data Powered by Accord Fintech
| Ticker | Name | Price(INR) | Change(INR) | %Change |
|---|---|---|---|---|
| UNIVAFOODS | Univa Foods Ltd. | - | -11.38 |
 100.00%
|
| FABTECH | Fabtech Technologies Ltd. | 146.16 | -17.05 |
10.45%
|
| PARASPETRO | Paras Petrofils Ltd. | 2.61 | -0.28 |
9.69%
|
| CONSOFINVT | Consolidated Finvest & Holdings Ltd. | 183.01 | -13.0 |
6.63%
|
| VESUVIUS | Vesuvius India Ltd. | 553.00 | -35.0 |
5.95%
|
Data Powered by Accord Fintech
| Ticker | Name | Price(INR) | Change(INR) | %Change |
|---|---|---|---|---|
| AVANTIFEED | Avanti Feeds Limited | 960.0 | 160.00 |
20.00%
|
| VTL | Vardhman Textiles Limited | 511.5 | 54.25 |
11.86%
|
| BHARATFORG | Bharat Forge Limited | 1588.0 | 144.30 |
10.00%
|
| SANSERA | Sansera Engineering Limited | 1873.1 | 129.20 |
7.41%
|
| BANKINDIA | Bank of India | 160.0 | 8.33 |
5.49%
|
Data Powered by EOD Historical Data (“EODHD”)
| Ticker | Name | Price(INR) | Change(INR) | %Change |
|---|---|---|---|---|
| HBSL | HB Stockholdings Limited | 61.31 | -1.25 |
2.00%
|
| VERTOZ | Vertoz Advertising Limited | 53.05 | -1.08 |
2.00%
|
| LEXUS | Lexus Granito (India) Limited | 23.91 | -0.13 |
0.54%
|
| GANGESSECU | Ganges Securities Limited | 121.0 | -0.02 |
0.02%
|
Data Powered by EOD Historical Data (“EODHD”)
Daily Wrap
View All


Add-Ons
Elevate your Investment Experience with Kalkine’s Expert Research and Analytics
Stock Screeners
View All


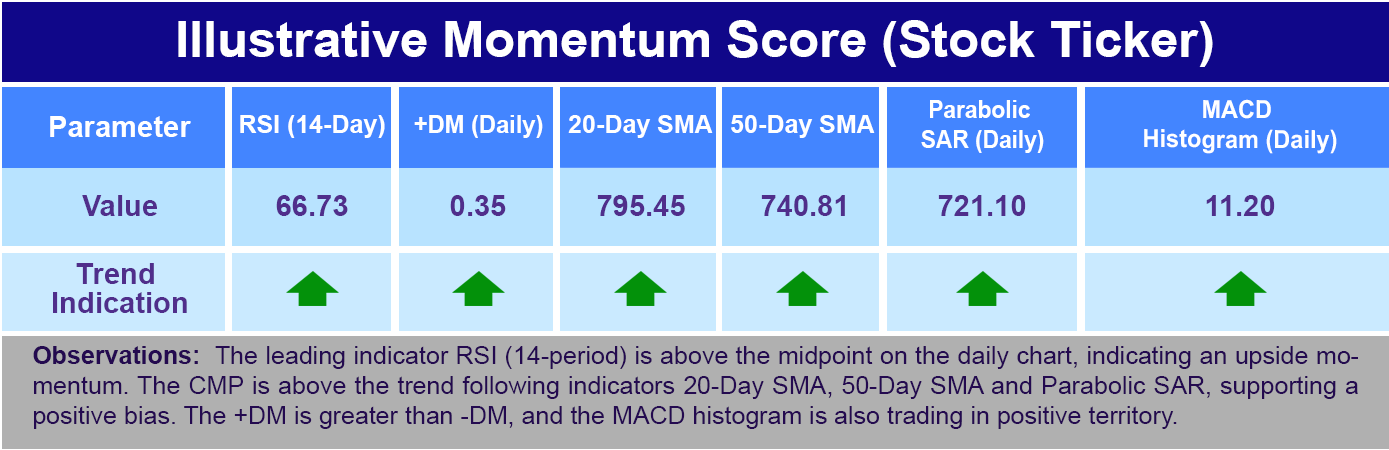
Kalkine Momentum Score
View All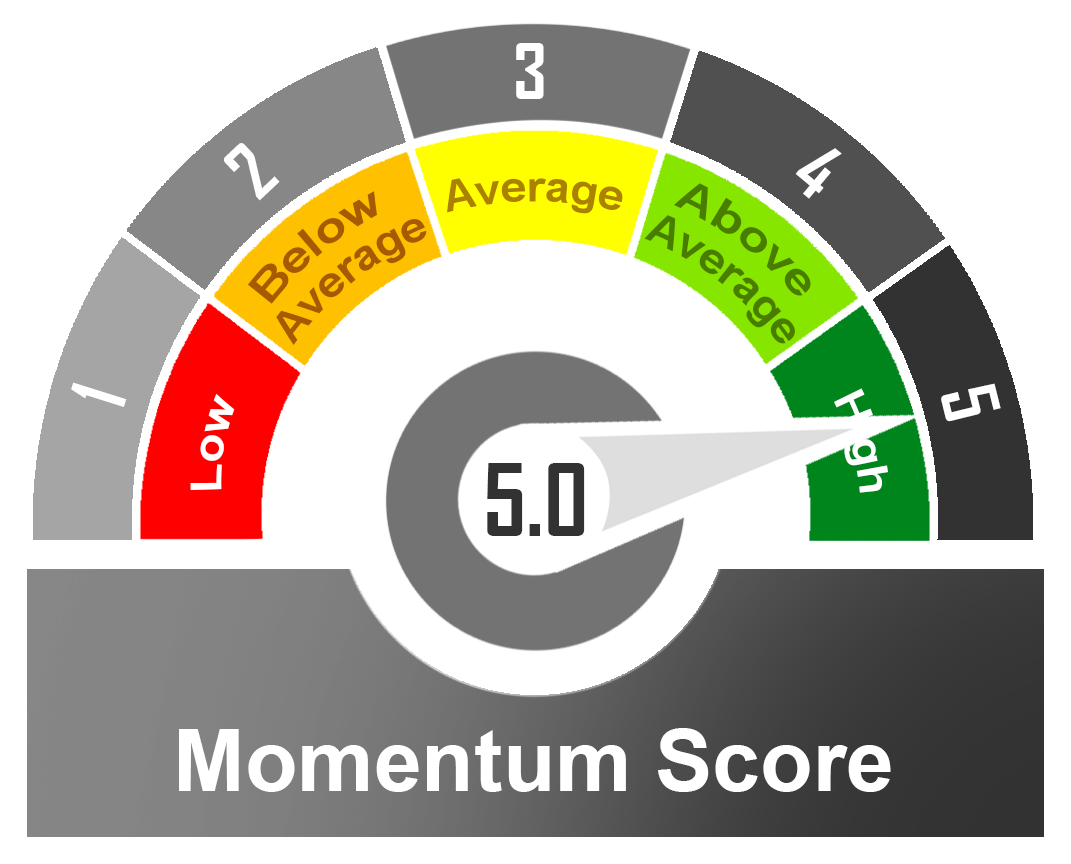
Data Source: REFINITIV, Analysis: Kalkine Group; Note: Momentum score is based on certain criteria’s been met for technical indicators such as Relative Strength Index (RSI), Simple Moving Average (SMA), Parabolic SAR, Direction Movement Index (DMI) and MACD Histogram.