
SBFC Finance Limited (NSE: SBFC) plunged 12.00% to ₹89.43 on 27 January 2026, defying a steady Q3 FY2026 performance and underscoring growing market unease. The sharp sell-off appears driven by investor caution around potential interest rate shifts, rising household leverage, subdued loan demand, and intensifying competition across Tier 2 and Tier 3 markets. As macro conditions evolve, the bank’s ability to preserve asset quality remains firmly in focus.
Is SBFC entering a stable growth phase despite the sell-off?
Q3 FY2026 results highlight SBFC’s resilient operating performance. Assets under management rose 29% year on year to ₹10,478 crore, reflecting sustained demand across core lending segments. Profit after tax increased 34% to ₹118 crore, supported by improved operating leverage and tighter cost control, with the cost-to-income ratio easing to 35%.
Despite the negative market reaction, SBFC’s disciplined lending approach, selective branch expansion, and continued focus on asset quality underpin a more stable near-term outlook, raising the possibility that the recent share price decline may be driven by market caution rather than weakening fundamentals.
Technical View: Price Action Fights Back — Is a Stabilisation Underway?
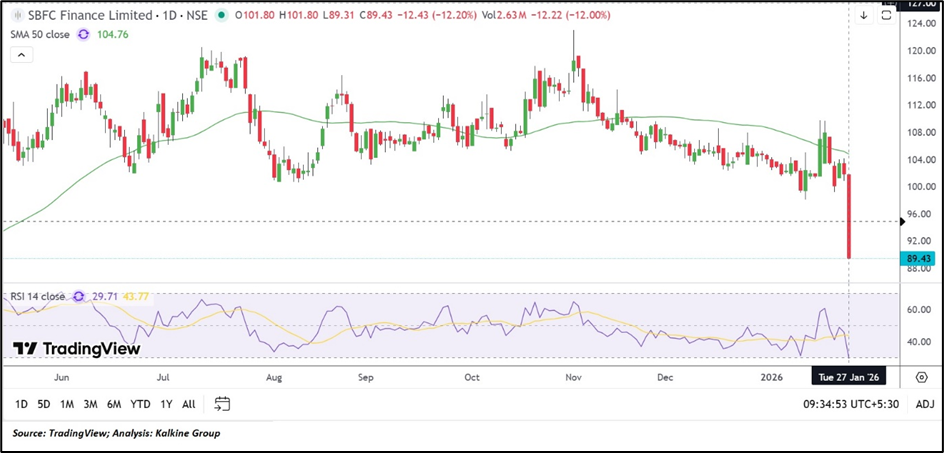
From a technical perspective, prices remain below the 50-day Simple Moving Average at ₹104.84, which continues to act as an immediate resistance zone. However, recent behaviour suggests consolidation rather than a deeper breakdown following the decline. The 14-day RSI is near 29.71, holding above oversold levels and pointing to stabilising momentum. Support is seen around ₹84.00 and ₹79.00, while resistance is placed near ₹100.00 and ₹108.00.
Bottom Line: Price Action Suggests SBFC Ready to Break Higher
SBFC’s recent dip belies its strong fundamentals, signalling a shakeout rather than a breakdown. With price action holding above key support zones and momentum indicators pointing positive, the stock appears poised for a rebound. If prices continue to hold above key support zones and operating momentum remains intact, the near-term setup may gradually stabilise, with upcoming quarters providing clearer direction on sustainability and growth visibility.