
Tata Power is planning to finalize a 10-gigawatt wafer and ingot manufacturing project by January 2026, with an estimated investment of Rs 6,500 crore, according to CEO and MD Praveer Sinha. The company is evaluating potential locations across Odisha, Tamil Nadu, and Andhra Pradesh, taking into account state policies and incentives before making a final decision.
This project forms a key part of Tata Power’s backward integration strategy, complementing its existing solar cell and module manufacturing operations. Once operational, the facility will enable Tata Power to become a fully integrated solar manufacturer, producing wafers, ingots, cells, and modules. Further clarity on the project is expected in the last quarter of FY26.
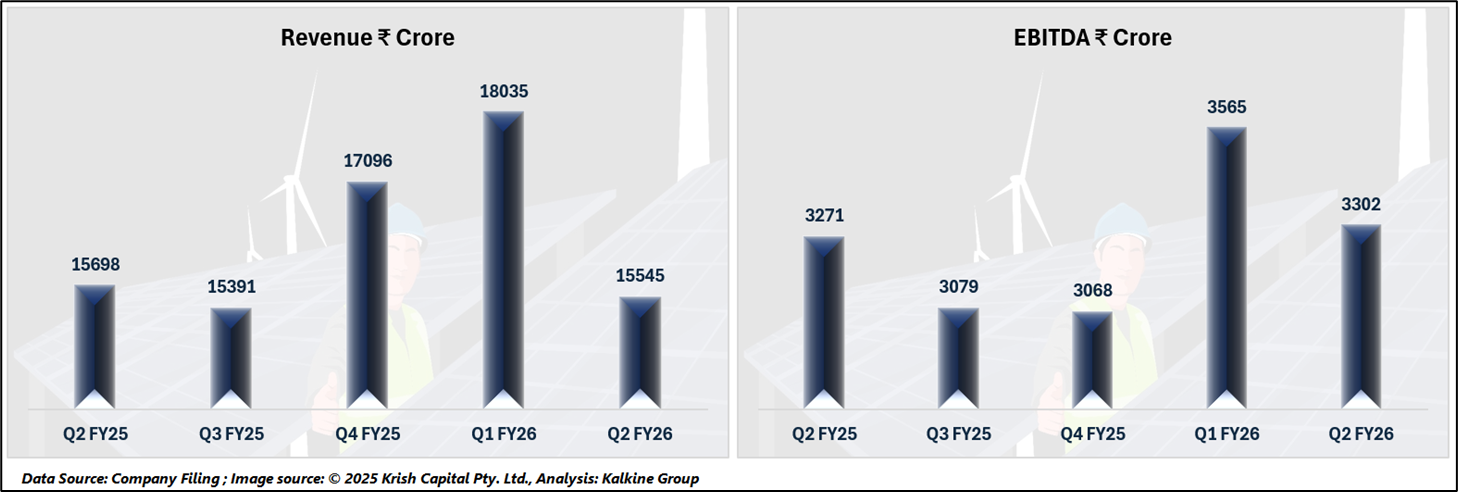
Financial Performance Overview
Tata Power’s financial performance has shown some fluctuations over the past five quarters. Revenue peaked at ₹18,035 crore in Q1 FY26 before declining to ₹15,545 crore in Q2 FY26. Operating profit during this period was ₹ 3302 crore. Net profit rose from ₹1,093 crore in Q2 FY25 to ₹1,245 crore in Q2 FY26, reaching a high of ₹1,306 crore in Q4 FY25. Earnings per share (EPS) varied correspondingly, with a high of ₹3.32 in Q1 FY26 and a decline to ₹2.88 in Q2 FY26.
Diversified Energy Portfolio and Nuclear Plans
Currently, Tata Power has a diversified power portfolio of 15.9 GW spanning thermal, solar, and wind energy. In addition to expanding its solar manufacturing capabilities, the company is exploring entry into the nuclear energy sector. Plans are underway to set up small modular reactors with capacities of 20–50 MW, subject to necessary legal approvals.
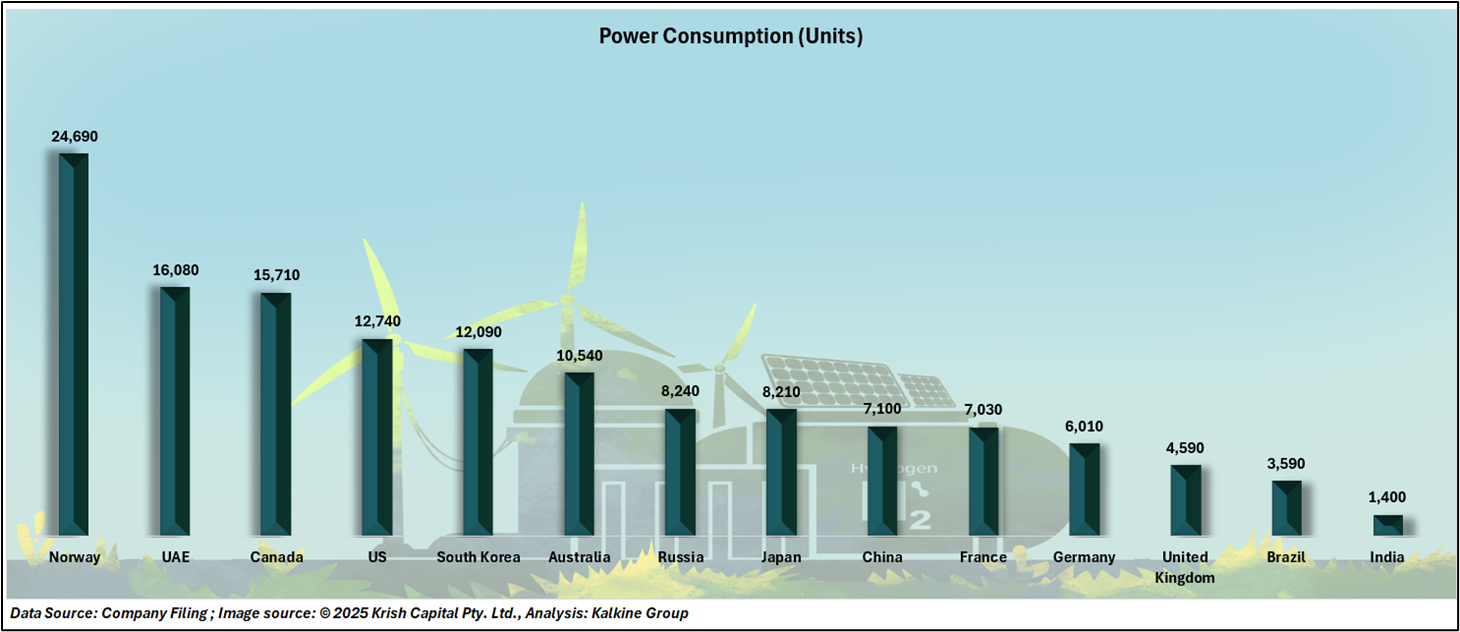
Global and Domestic Power Consumption Trends
Global per capita power consumption in 2024 shows significant variation. Norway leads at 24,690 units per person, followed by the UAE (16,080 units) and Canada (15,710 units). The US and South Korea recorded 12,740 units and 12,090 units respectively, while Australia consumed 10,540 units. Russia and Japan averaged around 8,200 units, China and France just over 7,000 units, Germany and the UK at 6,010 units and 4,590 units, and India and Brazil at the lower end with 1,400 units and 3,590 units per capita.
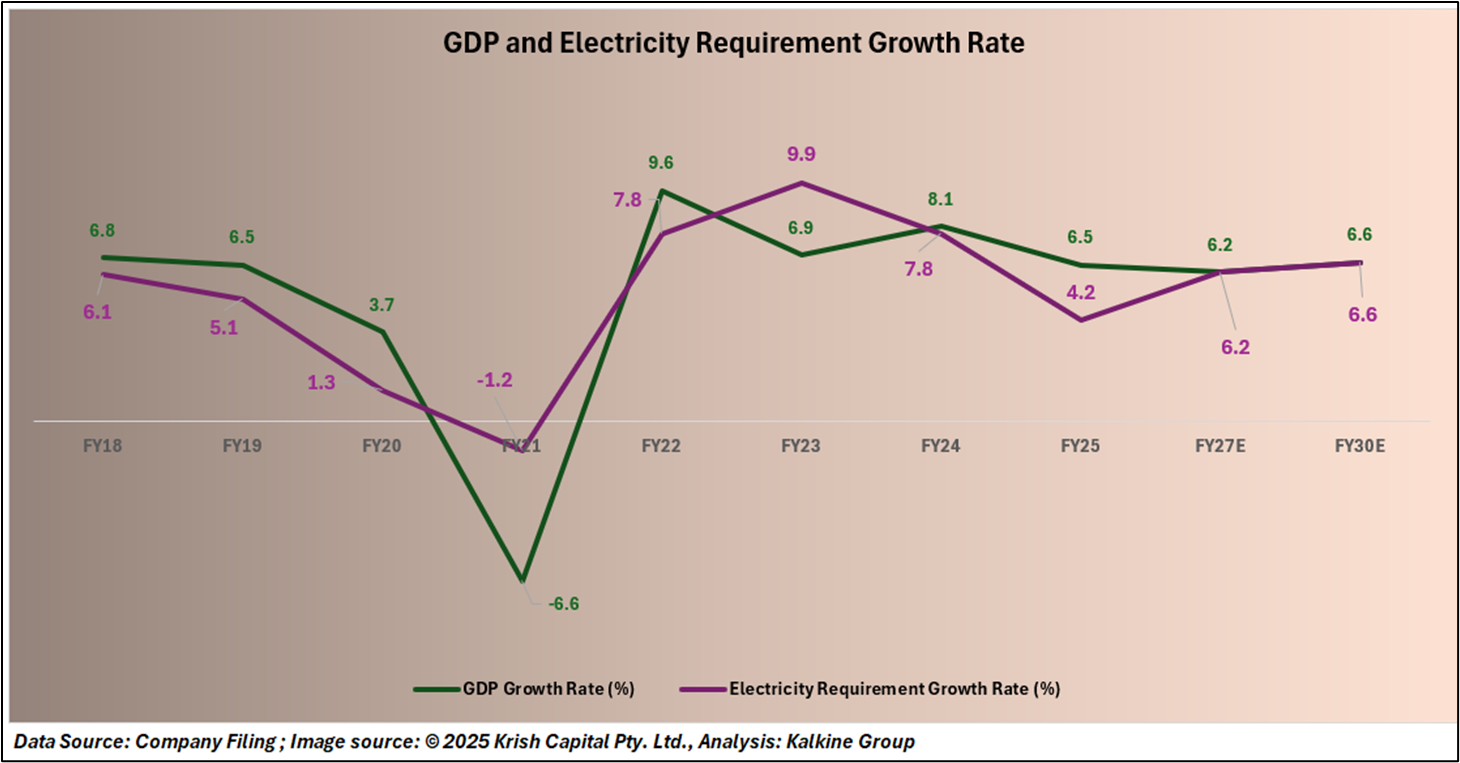
India’s GDP growth has varied over recent years, from 6.8% in FY18 to a contraction of 6.6% in FY21, followed by a recovery to 9.6% in FY22. Future projections estimate GDP growth of 6.2% in FY27 and 6.6% in FY30. Electricity demand growth has generally mirrored GDP trends, with 6.1% in FY18, a decline of 1.2% in FY21, and a rise to 7.8% in FY22. Going forward, electricity demand is projected to grow at 6.2% in FY27 and 6.6% in FY30.
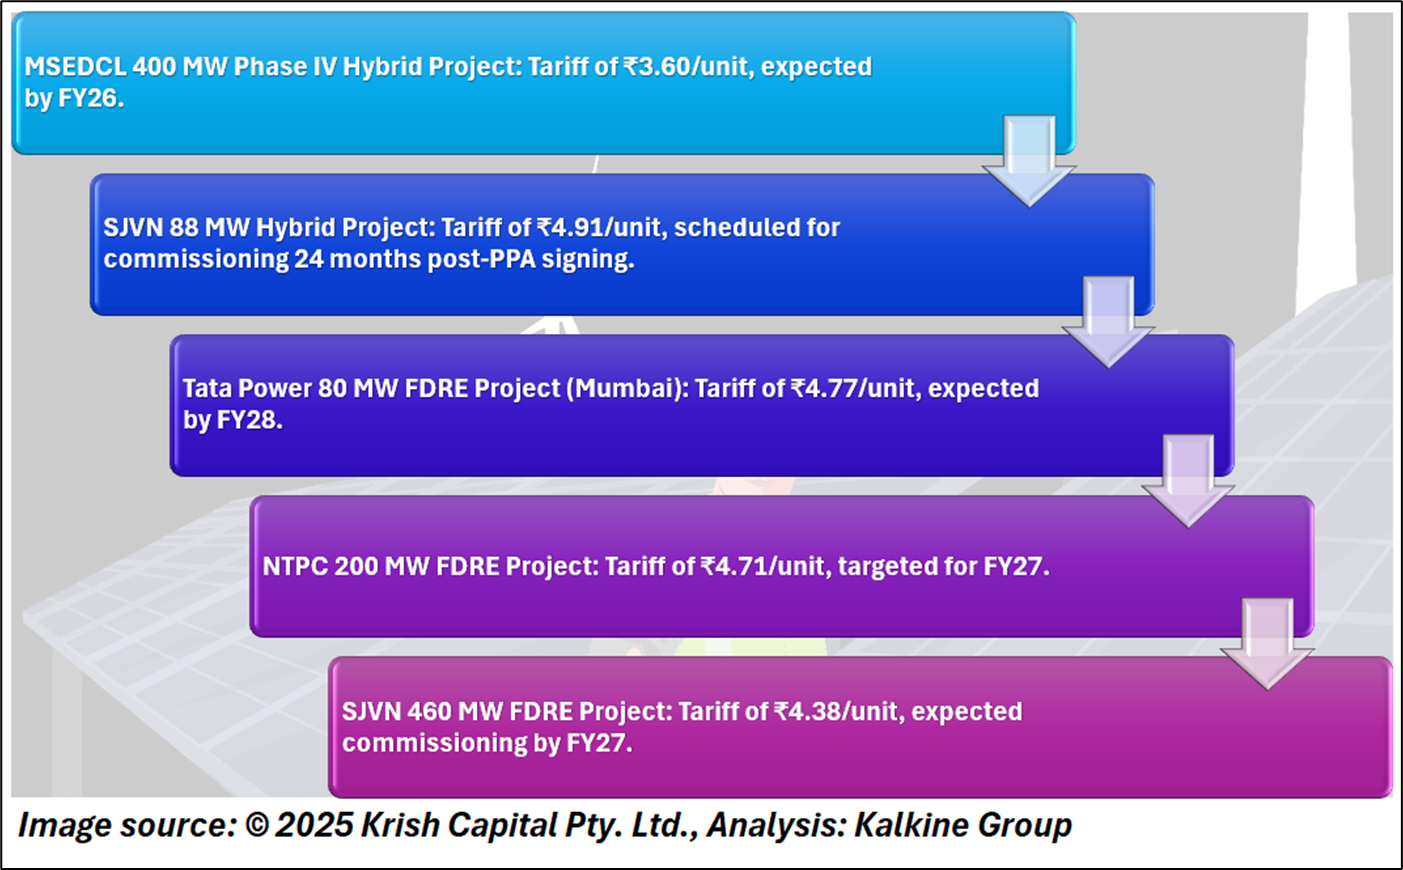
Pipeline of Hybrid and FDRE Projects
Technical Analysis

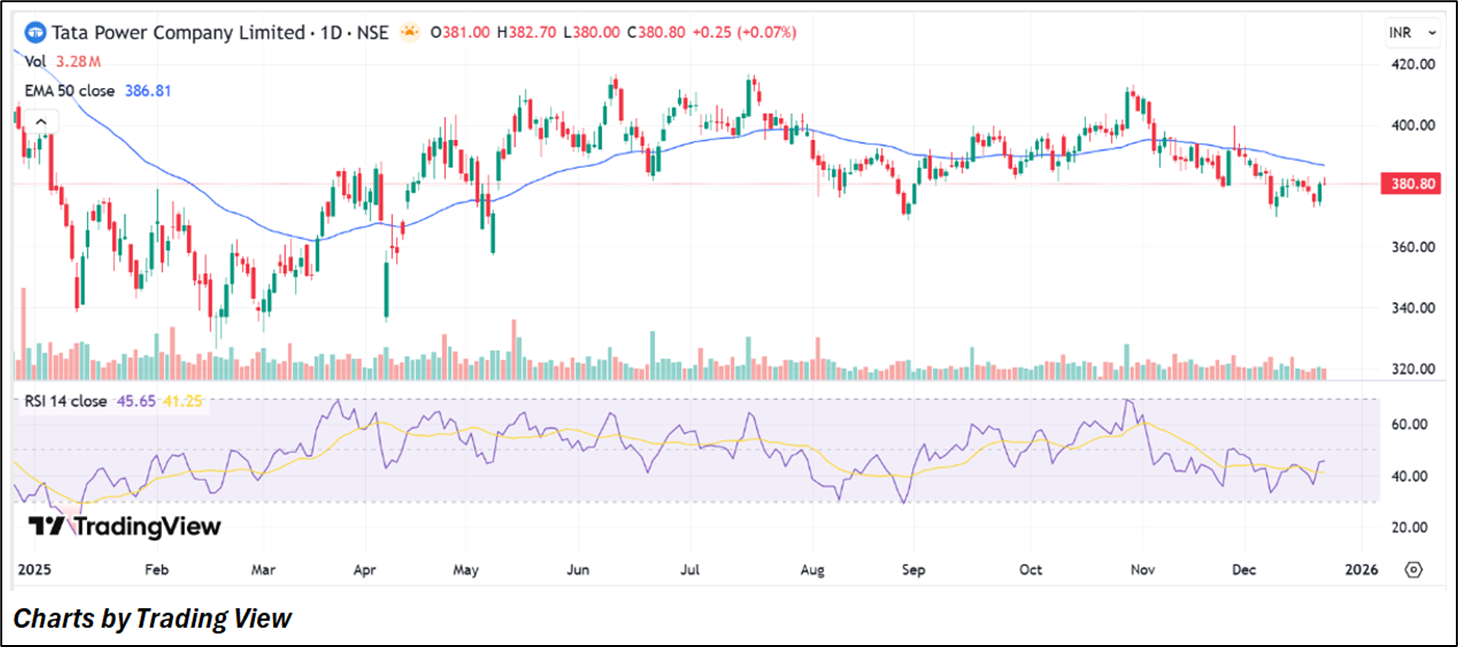
Tata Power closed at INR 380.80, remaining below its 50-day EMA (~INR 387), which indicates a mildly negative short-term bias. The price structure continues to reflect a sideways-to-weak consolidation, with a sequence of lower highs since the November peak, signalling gradually weakening momentum. The RSI at ~46 stays below the neutral 50 level, pointing to subdued buying interest and the absence of strong bullish momentum. Trading volumes remained moderate, providing no clear evidence of accumulation at current levels.
Conclusion
Tata Power’s long-term strategy remains anchored in renewable integration and capacity expansion, supported by improving profitability and diversified assets. However, near-term financial moderation and a weak technical setup suggest limited upside in the short term, with clearer directional cues likely to emerge alongside project execution milestones.